


Taxes in the US vs Europe have always been a heated debate, and 2026’s numbers explain why. A company can pay a 21% federal corporate rate in the US, per the IRS, or 10% in Bulgaria, per PwC, while US payroll taxes run 15.3% against a European average of past 35%, per OECD Taxing Wages 2026. That gap changes the expansion math for every company. So what separates the terms and conditions on each side of the Atlantic, clause by clause?
This guide breaks down the full 2026 tax breakdown for the US, Western Europe, and Eastern Europe – corporate rates, personal income tax, social security, and VAT – country by country. You’ll see exactly how taxes in the US vs EU shape payroll costs, compliance burden, and margins, plus which Eastern European markets offer the lightest tax terms for your next expansion.
Key Takeaways
- US and European tax systems differ in mechanics more than rates: the US layers federal, state, and local taxes; Europe centralizes withholding through employers and relies on VAT.
- The US has a federal CIT rate of 21% and a PIT rate up to 50.3% (IRS). The average European tax rate is 21.6%, but Eastern Europe stays leaner – Bulgaria at 10% CIT/PIT (PwC).
- From a US taxes vs Europe angle, 2026 policy is diverging: Europe leans on R&D and defense incentives, while the US gains tax certainty but faces weaker IRS enforcement and new tariffs.
- Eastern Europe offers 2+ million engineers, strong tech skills, and senior salaries 46–56% below US levels, with Bulgaria, Romania, and Poland ranking in the CEE region’s top 6 for business climate (Alcor’s recruitment department research).
- Alcor’s software R&D center model helps tech companies build owned Eastern European and LATAM engineering teams without opening a local entity by combining top-10% recruitment, EOR/COR, and 360-degree operational support – with full IP protection, zero buyouts, transparent pricing, and direct team ownership from day one.
Comparison of US and European Tax Rates
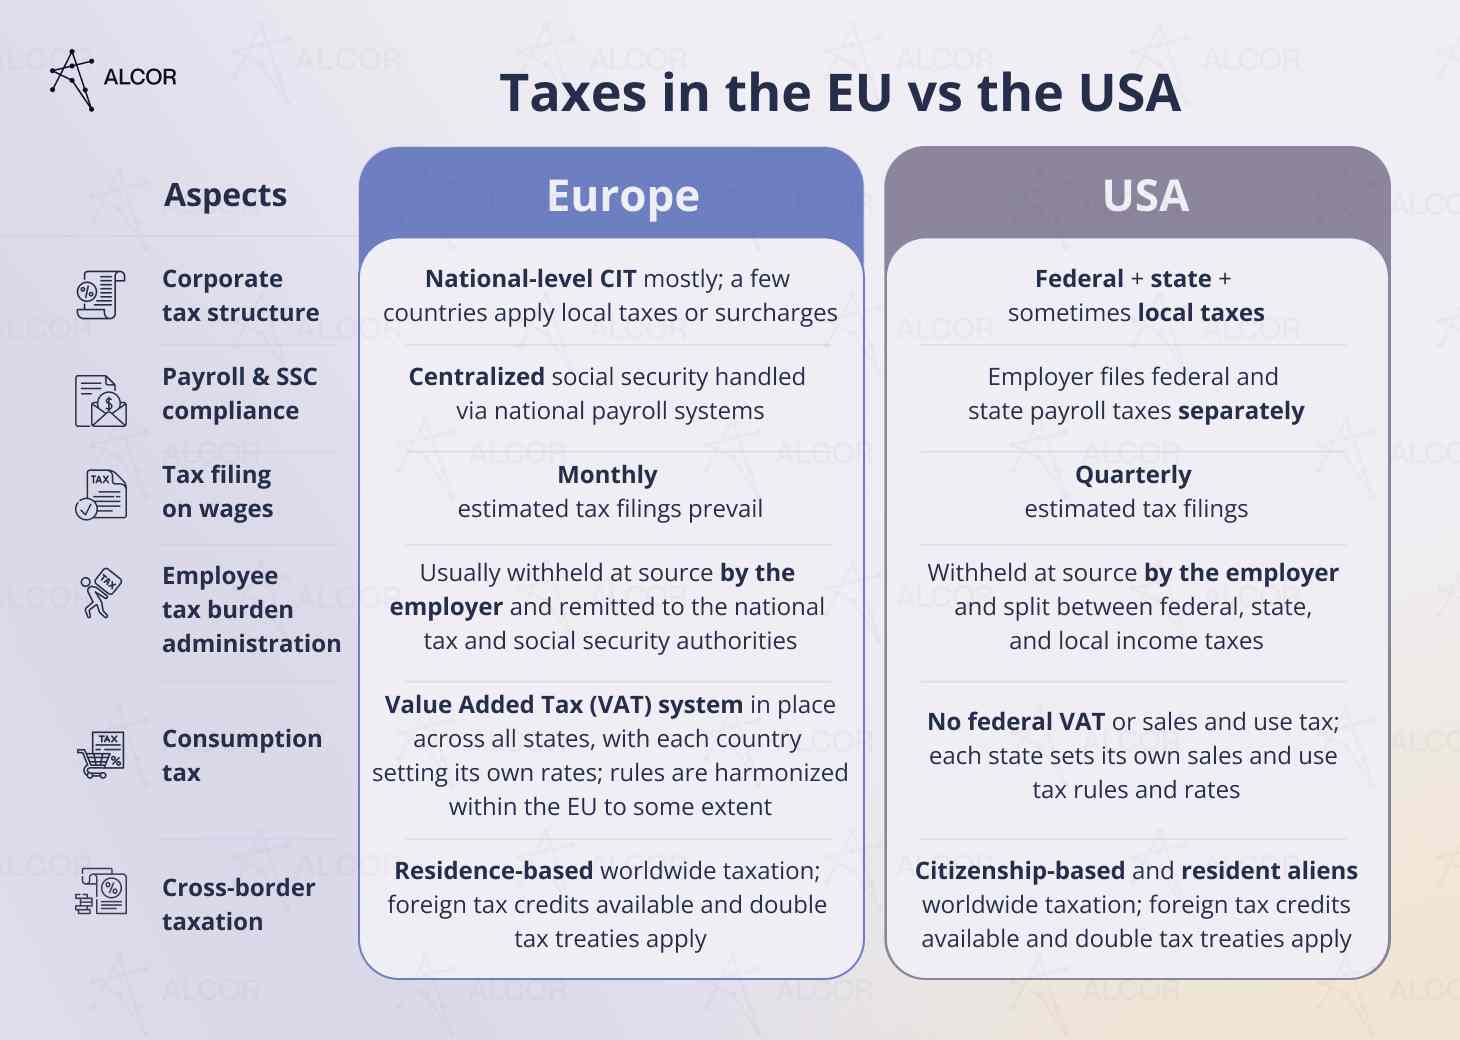
US and European tax systems differ mainly in administration, filing, and compliance burden. The US layers federal, state, and sometimes local taxes, with quarterly filings, sales tax, FUTA, SUTA, and FICA obligations. Europe centralizes withholding through employers, relies on VAT across the supply chain, and often carries higher social security burdens. Corporate tax rates are converging, but country-level PIT, SSC, and VAT rules still vary significantly across markets.
When it comes to American taxes vs European taxes, the difference is less about what gets taxed than about who calculates it and when. Both regions run different tax systems: the US layers federal, state, and sometimes local taxes, with businesses filing quarterly and reconciling everything at year-end. Most of Europe centralizes tax withholding through employers, with national tax authorities automatically calculating what residents owe – shifting more of the calculation burden onto businesses upfront.
VAT and sales tax mark another major difference in taxes in the EU vs the USA. Where the US relies on point-of-sale sales tax collected mostly at the retail end, the EU’s VAT system pushes reporting and remittance onto every business in the supply chain, adding a compliance layer that US companies don’t budget for when they first hire in Europe.
See the table below to explore the peculiarities of the taxes in the EU vs the USA:
US tax rates overview
To understand how taxes work in America, start with corporations: they pay a flat 21% federal corporate income tax, plus a state corporate income tax ranging from 2.0% in North Carolina to 11.5% in New Jersey, depending on the state’s tax brackets. Nevada, Texas, and Wyoming impose no corporate tax at all, relying on gross receipts taxes instead, while Nebraska, North Carolina, and Pennsylvania all cut their corporate rates effective January 1, 2026, to 4.55%, 2.0%, and 7.49%, respectively, according to Tax Foundation.
In addition to the standard corporate rate, the Corporate Alternative Minimum Tax (15%) applies to companies with profits above $1 billion, ensuring a minimum tax burden on large firms regardless of deductions, as outlined on Congress.gov.
Beyond corporate tax, there’s the equivalent of personal income tax, levied at the federal, state, and sometimes local levels, making up the bulk of each level’s revenue. Both federal and state income taxes are withheld from employees‘ wages and remitted by their employers:
- Federal tax ranges from 10% to 37% across different tax brackets, according to the Tax Foundation.
- State income taxes range from 1.4% to 13.3%, depending on the state and bracket, with some states imposing none at all, according to the Tax Foundation.
Most employers also pay the federal unemployment tax (FUTA) – 6% of the first $7,000 of each employee’s annual wages, reducible to as little as 0.6% via SUTA credits, per the IRS. State unemployment taxes (SUTA) apply on top, with rates set by state and by the employer’s claims history; unlike FUTA, a handful of states – including Alaska, New Jersey, and Pennsylvania – also require employees to contribute to SUTA.
On top of the unemployment tax, there’s FICA. According to the Employer’s Tax Guide (Publication 15), FICA combines Social Security (6.2%) and Medicare (1.45%), with the employer and employee each matching 6.2% of wages, for a total burden of 15.3%. The Social Security wage base rose to $184,500 for 2026, per the Social Security Administration – up from $176,100 in 2025 – while Medicare has no cap, plus a 0.9% surtax above $200,000.
On the whole, the average US tax rate looks different depending on where a company sits:
- Federal rates have stayed flat since the 2017 Tax Cuts and Jobs Act,
- State-level relief is actively lowering the average burden in several markets.
Beyond the four states cutting rates for 2026, Louisiana moved from a bracketed system that topped out at 7.5% to a flat 5.5% rate, effective January 1, 2025 – a cut that continues to shape the landscape a year later, according to the Tax Foundation.
In conclusion, while personal tax rates and payroll obligations add up quickly, falling state corporate rates are easing the load in many markets. The US tax rate compared to other countries remains, on balance, competitive – though how it compares depends heavily on which state, and which tax rates in Europe, you’re measuring against.
European tax rates overview
Unfortunately, no-tax countries are a myth – Monaco offers a 0% personal income tax rate but levies a 25% corporate income tax rate, and across European countries, the average combined corporate tax rate stands at 21.6% in 2026, according to the Tax Foundation.
While personal income tax (PIT) rates vary widely between countries and across income brackets within each country, tax rates in European countries vs the US turn out to be similar or even higher.
- When we consider the tax rate in Denmark vs the USA, it is approx. 35–60.5% – following Denmark’s 2026 reform that added a new top tax bracket for the highest earners, per PwC – against 10–50.3%, depending on the state.
- As for Germany’s tax rate vs the US, Germany’s personal income tax ranges from 0% to 45% (plus up to a 5.5% solidarity surcharge on top of income tax for high-income earners), according to PwC, against the US’s 10–50.3%, depending on the state.
When US taxes are compared with those of other countries, mostly Eastern European ones, the US comes out clearly higher. Czechia taxes personal income at just 15–23%, and it isn’t even the lowest in the region. That gap holds at the OECD level too: the OECD’s Taxing Wages 2026 report puts the average single-worker tax wedge across all 38 member countries, including the US, at 35.1% in 2025 – its highest level since 2018.
On social security, the contrast is stark between the European tax rates vs the USA ones. US payroll taxes (FICA) total 15.3%, whereas European systems can push the tax wedge to around 35% on average and up to 52.5% in Belgium, the OECD’s highest, according to the OECD’s Taxing Wages 2026 report.
Corporate tax is one area where European taxes vs American taxes are heading toward more alignment – the EU’s rollout of the Pillar Two global minimum tax aims to establish a 15% effective CIT floor across member states, although some low-tax countries are still negotiating its implementation.
The Highest and Lowest Tax Rates in Europe and the US
Tax rates affect expansion costs differently across the US, Western Europe, and Eastern Europe:
- US: 21% federal CIT plus state taxes up to 11.5%, PIT up to 50.3%, and payroll taxes around 15.3–16.2%.
- Western Europe: heavier top-end burden, including Denmark PIT up to 60.5% and France SSC around 67–70%.
- Eastern Europe: lighter rates, with Bulgaria at 10% CIT/PIT, Romania at 16% CIT and 10% PIT, and Hungary at 9% CIT.
While contrasting taxes in the USA vs the EU, the details can get overwhelming fast. That’s why Alcor’s legal team has prepared a table chart with tax rates across the US and 11 European countries, so you can see the full picture at a glance.
|
Country |
Corporate Income Tax (CIT), % |
Personal Income Tax, % |
Social Security Contributions, % |
|
US |
21-32.5% (+) approximate range: Federal – 21% flat rate State – 0-11.5% flat or progressive rates (varies by state) (+) Corporate AMT – 15% for large corporations |
10-50.3% approximate range: Federal – 10-37% progressive rates State – 0-13.3% flat or progressive rates (varies by state) |
15.3%-16.2% approximate range: Employer: 6.2% Social Security tax + 1.45% Medicare Employee: 6.2% Social Security tax + 1.45% Medicare Additional Medicare tax: 0.9% for high-income employees |
|
Denmark |
22% flat rate R&D incentives are available |
35–60.5% average range: State tax – 12.01- 15% Municipal tax – 25.068% (the country’s average) Labor market tax – 8% Church tax – 0.64% (optional) |
10,666-20,054 DKK/year approximate range: Employer: · Labor market pension (ATP) – DKK 2,376/year; · Contribution to maternity fund – DKK 1,550/year; · Industrial injuries insurance – DKK 252-9,640/year (may vary by the field of work) · Other social security schemes – DKK 5,300/year approx. Employee: · ATP pension – DKK 1,188/year |
|
France |
25% standard flat rate Small companies: 15% reduced tax under certain conditions Larger companies: 3.3% additional temporary contribution on corporate tax liability |
0-45% progressive rates (+) Surtax: 3% on taxable income over €250,000, and 4% on income over €500,000 |
67–70% approximate range: Employer: ~ 45%, Employee: ~ 22–25% |
|
Germany |
22-35.3%(+) approximate range: Federal – 15% flat rate (+) 5.5% solidarity surcharge on CIT amount Municipal trade tax –7-20.3%, depending on the location |
0-45% progressive rates (+) up to 5.5% solidarity surcharge on income tax for high-income earners [IM4] |
42.65% approximate rate: Employer ~ 21.1% Employee ~ 21.55% (may vary by location and industry) |
|
UK |
19-25% total range: 25% – applies to companies with profits over £250,000 19% – for companies with profits up to £50,000 Marginal Relief – for companies with profits between £50,000 and £250,000 (i.e. a sliding scale of tax rates 19-25%) |
0-45% progressive rates in England, Wales and Northern Ireland 0-48% progressive rates in Scotland |
17-23% approximate range: Employer – 15% on National Insurance contributions Employee – 8% on earnings between £12,570 and £50,270 a year; 2% on earnings over £50,270 a year |
|
Italy |
27.9% average rate: National – 24%; Кegional production tax – 3.9% average Reduced rate – 20% is available for companies that satisfy the conditions of the Italian 2025 Budget Law. |
24.23-47.23% approximate range: National income tax: 23% on taxable income up to €28,000 Regional tax: 1.23-3.33 % Municipal tax: 0-0.9 % |
40% approximate rate: Employer ~30% Employee ~ 10% |
|
Spain |
25% standard flat rate Newly created companies/startups: 15% under certain conditions R&D tax credits are also available |
19-54% approximate range: State rates: 9.5-24.5%; local rates: vary by region |
37.05-39.8% (+) approximate range: Employer ~ 30.57-33.27% (plus a variable rate for occupational accidents) Employee ~ 6.48-6.53%, depending on the type of contract. [IM5] (+) An additional contribution of 0.92-1.17% for high earners is applicable |
|
Poland |
19% standard flat rate Small taxpayers: 9% (with certain exceptions) |
12-32% (+) progressive rates: 12% for income up to PLN 120,000 and 32% applied to the portion of income that exceeds PLN 120,000 (+) 4% solidarity surcharge applied to the portion of income that exceeds PLN 1 million |
42.19-44.85% approximate range: Employer – 19.48-22.14% Employee – 22.71% (healthcare contribution included) |
|
Bulgaria |
10% flat rate |
10% flat rate |
32.7-33.4% approximate range: Employer – 18.92-19.62% Employee – 13.78% |
|
Romania |
16% standard flat rate Small taxpayers: 1% rate is available, with certain exceptions |
10% flat rate |
37.25-45.25% approximate range: Employer – 2.25-10.25% Employee – 35% |
|
Ukraine |
18% flat rate | 18% flat rate+ 5% Military tax |
Employer – 22% of salary, up to UAH 130K/month |
|
Hungary |
9-11% approximate range: National CIT: 9% Local business tax: 2% maximum, varies by municipality |
15% flat rate |
31.5% total: Employer – 13% Employee – 18.5% |
|
Sources: IRS, Social Security Administration, Tax Foundation, PwC Worldwide Tax Summaries, OECD (Taxing Wages 2026, Corporate Tax Statistics 2026), Louisiana Department of Revenue, Alcor’s 2026 payroll and labor data | |||
*Please note that while the chart is designed to highlight key differences between European tax rates vs the US, it doesn’t capture every nuance or exception due to the complexity of tax systems. Data was updated for 2026, and the chart should be treated as a general reference rather than a substitute for professional tax advice.
Are you looking for IT staffing in Europe? Contact us to learn more!
European tax rates vs the US break down into a few clear takeaways:
- Corporate and personal income tax rates run similar in the US and Western Europe (France, Denmark, Germany, Italy) – with France and Denmark posting the highest Euro tax rates of the group. Corporate and personal income taxes are far higher in the US than in low-tax countries in Europe like Poland, Bulgaria, Romania, Ukraine, and Hungary – which is why European tax rates compared to the US come out more favorable in Eastern Europe specifically.
- Social security flips the pattern: looking at Denmark’s tax rates vs the USA specifically, Denmark sits far below the US’s 15.3–16.2% range, since it charges flat annual amounts rather than a percentage of salary. Every other country in the table – including the UK – runs higher than the US here.
- Bottom line: Eastern Europe wins on personal income tax specifically, while US corporate income tax and Social Security contributions remain comparatively reasonable compared with most of Europe. On the whole, European tax rates, compared with those in the US, favor Eastern Europe far more consistently than they do Western Europe.
Launching in the US or Western Europe is still viable, but Eastern Europe wins on combined tax rates, developer salaries, and back-office costs.
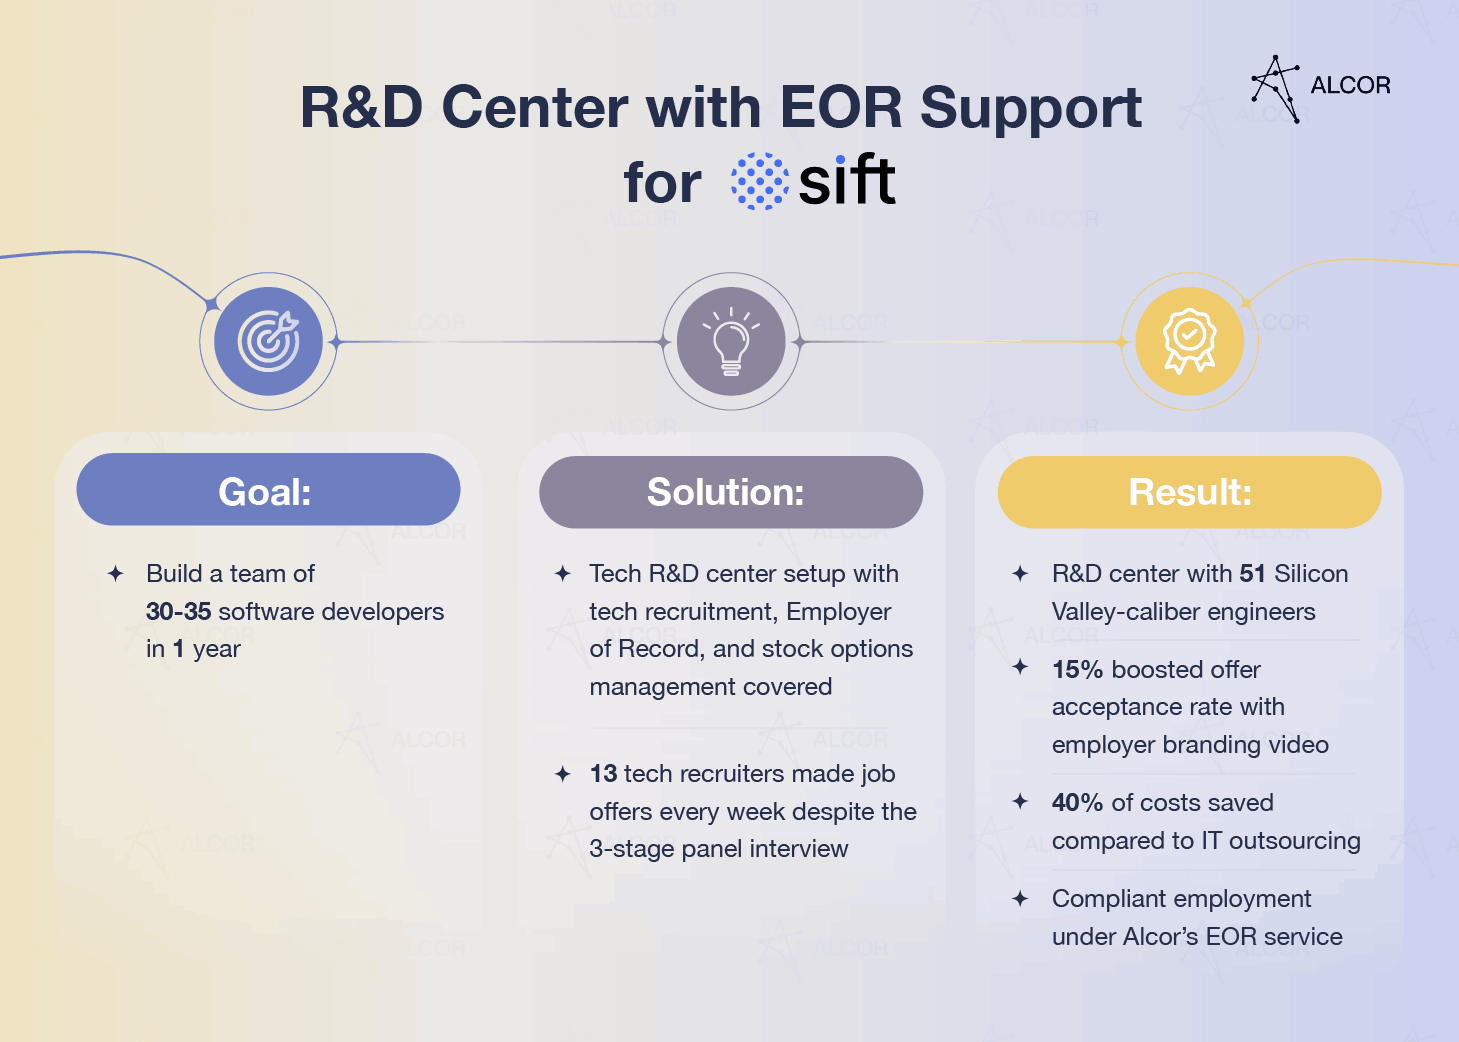
Sift saw that gap and acted on it, building a 30-developer team in Poland and Ukraine to capture the advantage, while Alcor handled the full scope of the expansion:
- Compliance with both European and US law
- Taxes, labor law, and contracts across both markets
- IP rights protection and stock option structuring
- Full-cycle tech recruitment of senior developers
The result: a fully compliant, fully owned engineering team in Eastern Europe – no legal headaches, no compromises on ownership.
Considering the CEE region for your expansion? Learn more about tax rates in Romania and Polish taxes!
Many US tech companies default to Eastern Europe for software development outsourcing – but outsourcing means handing over control of your codebase and your team. Alcor’s software R&D center model gives you the same access to Eastern European developers with full IP ownership, direct management, and built-in compliance on taxes, payroll, and labor law. Keep reading to see how it works.
Recent Trends in European vs the US Tax Policies: 2026 Update
Tax policy in 2026 is pushing Europe and the US in different directions. Europe is using defense, energy, and R&D incentives to strengthen strategic autonomy and attract investment in innovation. The US offers greater corporate tax certainty through permanent TCJA provisions, but weaker IRS capacity and protectionist tariffs pose risks. For tech companies, Eastern Europe is becoming a more predictable base for expansion overall.
Main trend in Europe: strategic autonomy
The russia’s war against Ukraine exposed Europe’s overdependence on external energy and fragile supply chains. Combined with escalating US-China trade tensions, the European Union has actively pursued “strategic autonomy” ever since.
- Defense and energy investment: EU defense spending reached €418 billion in 2025, up 20% year-over-year, and is projected to climb to €454 billion in 2026, according to the European Defence Agency. The ReArm Europe / Readiness 2030 Plan aims to mobilize up to €800 billion in defense-related investment by the end of the decade – much of it paired with corporate tax relief or investment incentives to pull in private-sector capital.
- Positioning as a neutral hub: In response to US-China trade fragmentation, Europe is marketing political stability, a deep talent pool, and regulatory transparency as reasons to build there instead.
- R&D incentives: France, Poland, and Spain have all rolled out generous R&D tax credits and deductions for greentech companies. Horizon Europe alone is investing €14 billion in research and innovation partnerships for 2026-2027, according to the European Commission – funding that pushes the real cost of innovation in Europe below what it runs at in the US.
Impact: From a US taxes vs Europe angle, geopolitical turbulence has strengthened Europe’s tax competitiveness, not weakened it. As companies rethink China-dependent supply chains and rising US production costs, Europe – especially lower-cost locations like Poland and Romania – is emerging as the default alternative for expansion. Regulatory certainty and political alignment are making Europe an increasingly attractive base for cross-border innovation.
Main trend in the US: tax strategy shifts & protectionism
The current US administration has reshaped the tax and regulatory landscape through three major moves:
- The One Big Beautiful Bill Act, signed in July 2025, makes permanent key provisions of the 2017 TCJA, including the 21% corporate tax rate and pass-through deductions, while extending bonus depreciation and R&D tax credits through 2026.
- IRS enforcement has moved in the opposite direction from what was originally planned. The agency’s 2022 enforcement funding boost has been largely rescinded, cutting the enforcement budget by roughly 18–40% and audit staff by 25–37%, according to CNBC and the Center on Budget and Policy Priorities. Rather than a broad crackdown, enforcement is now narrowly targeted at the highest-value returns – large corporations, complex partnerships, and high earners – while overall audit capacity has fallen.
- US trade policy has become more protectionist in practice, not just rhetoric. A 25% Section 232 tariff on select advanced computing chips took effect on January 15, 2026, per the White House – though it exempts chips used for data centers, R&D, startups, and domestic manufacturing, thereby shielding much of the tech sector’s actual imports. Separately, tariffs on China-made chips have been delayed until June 2027. Analysts still warn that a broader 25% tariff on chip imports could reduce US economic growth by about 0.18% in the first year and 0.76% over ten years if expanded beyond the current narrow scope, according to the Information Technology & Innovation Foundation.
Impact: These shifts create a mixed picture for US-based tech companies: tax rules are more predictable, audits are less likely for most, but tariffs remain a real risk. TCJA permanence gives real planning certainty, and eased IRS enforcement lowers near-term audit risk for most companies – though large corporations and complex structures remain squarely targeted. Tariffs stay the bigger risk: current exemptions protect data centers and R&D, but any expansion would raise costs for hardware-reliant companies and push more to diversify beyond the US.
As a result, the calculus for scaling tech operations in the US has become more complex and less predictable – prompting more companies to explore favorable, lower-friction jurisdictions such as those in Eastern Europe.
US vs Europe: Strategic Decision for Global Expansion
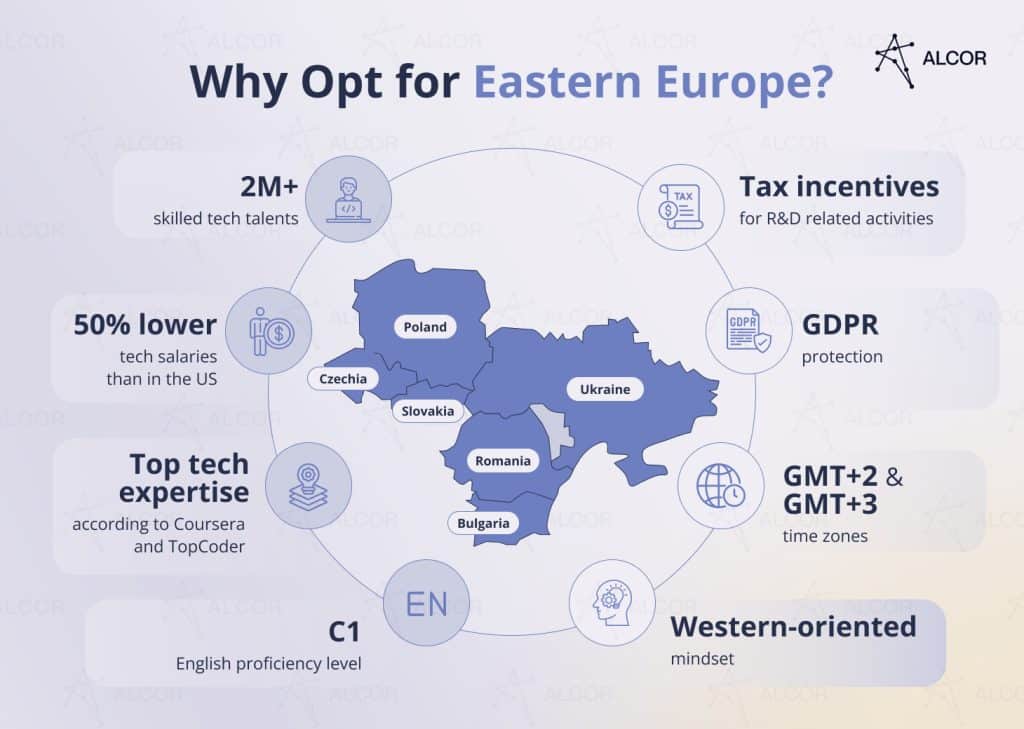
Choosing between the US and Europe for expansion comes down to access to talent, taxes, cost efficiency, and setup risk. Eastern Europe stands out for having 2+ million software engineers, strong tech and data skills, R&D incentives, and senior developer salaries that are 46–56% below US levels. Poland and Romania bring large talent pools and R&D tax benefits; Ukraine offers Diia.City relief, and Bulgaria adds 10% CIT/PIT.
Eastern Europe’s best business climates cluster in three countries: Bulgaria, Romania, and Poland, all ranked in the region’s top 6 per the StartupBlink business environment report 2026. Here’s what’s driving it:
- The EE startup ecosystem grew faster than the European one over the last decade, at an average rate of 12x compared to 7x, according to Dealroom. Poland, Ukraine, and Czechia have the most value-rich ecosystems and the highest number of unicorns.
- Eastern Europe attracted €3.6 billion in VC funding across 1,034 deals in 2025, according to the Venture in Eastern Europe 2025 Report, underscoring a mature, resilient market in the CEE region that continues to attract significant capital.
- Eastern Europe is home to 2+ million software engineers, according to Alcor’s recruitment department research, who are real tech ninjas. They consistently rank highly in various coding competitions, such as TopCoder and the Coursera 2025 global skills ranking, as well as in the Global Innovation Index 2025.
Planning to expand into Europe? Discover how a PEO in Europe can help you hire talent while navigating local tax and employment regulations.
Here’s how top rankings translate into real advantages across four standout EE locations:
Poland
- 778,800 ICT professionals and 74K STEM/ICT graduates (Alcor’s recruitment department research)
- 46% lower senior base dev salaries vs the US (Alcor’s recruitment department research)
- #4 for tech skills and #3 for data science in EE (Coursera Global Skills Report 2025)
- Deduction of 200% of qualifying R&D costs (Poland.Business Harbour, gov.pl)
- Best for: Companies hiring multiple senior roles at once – Poland’s talent pool is #1 in the region.
Discover how to hire developers in Eastern Europe within just 2-6 weeks!
Romania
- 207,800 ICT professionals and ~35,600 STEM/ICT graduates (Alcor’s recruitment department research)
- 49% lower senior dev salaries vs the US (Alcor’s recruitment department research)
- #6 for both tech and data science skills in EE (Coursera Global Skills Report 2025)
- Deduction of an additional 50% of eligible R&D expenses – or, as of 2026, a 10% refundable tax credit as an alternative (PwC; KPMG)
- Best for: Companies running R&D-heavy roadmaps – Romania’s tax credit options make it one of the strongest markets in EE for teams doing continuous product development.
Planning to scale in Romania? Explore IT recruitment in Romania and hire senior engineers with the right skills, salary range, and compliance setup.
Ukraine
- 305,000 ICT professionals and 40K STEM graduates (Alcor’s recruitment department research)
- 56% lower senior dev salaries vs. the US (Alcor’s recruitment department research)
- #7 for both tech and data science skills in EE (Coursera Global Skills Report 2025)
- Reduced tax rates via the Diia.City regime – 5% personal income tax vs the standard 18% (PwC Ukraine)
- Best for: Cost-conscious teams – Ukraine offers the steepest salary savings in the region, backed by Diia.City’s tax relief.
Bulgaria
- 141,500 ICT professionals and 4,156 STEM graduates (Alcor’s recruitment department research)
- 53% lower senior dev salaries vs. the US (Alcor’s recruitment department research)
- #5 for both tech and data science skills in EE (Coursera Global Skills Report 2025)
- 10% flat CIT and PIT – the lowest personal income tax in the EU, and the second-lowest corporate tax after Hungary’s 9% (PwC Bulgaria)
- Best for: Companies prioritizing tax simplicity – Bulgaria’s flat 10% CIT and PIT make cost forecasting straightforward.
Choosing between tax benefits, legal ease, talent availability, and cost-efficiency across Eastern Europe doesn’t have to be a solo decision. Alcor helps you pick the right location and handles the expansion itself.
We make it possible with our tech-exclusive Employer of Record in Europe:
- Save up to 3.5 months on company setup
- Choose between FTE and B2B options
- Transparent pricing – no prepayment, markups, or hidden fees
- Get Customer Operations Manager support with one-day response times
See how it worked for US tech company BigCommerce: with Alcor’s tech-exclusive EOR, they employed their development team through our legal entity, stayed fully compliant with Ukrainian labor law and GDPR, and received timely, accurate payroll through our accounting outsourcing services. We also ran in-house tech recruitment and secured office space for their dev team – one solution covering the entire R&D center build.
Alcor Provides 360° Operational Support in LATAM & Eastern European Countries
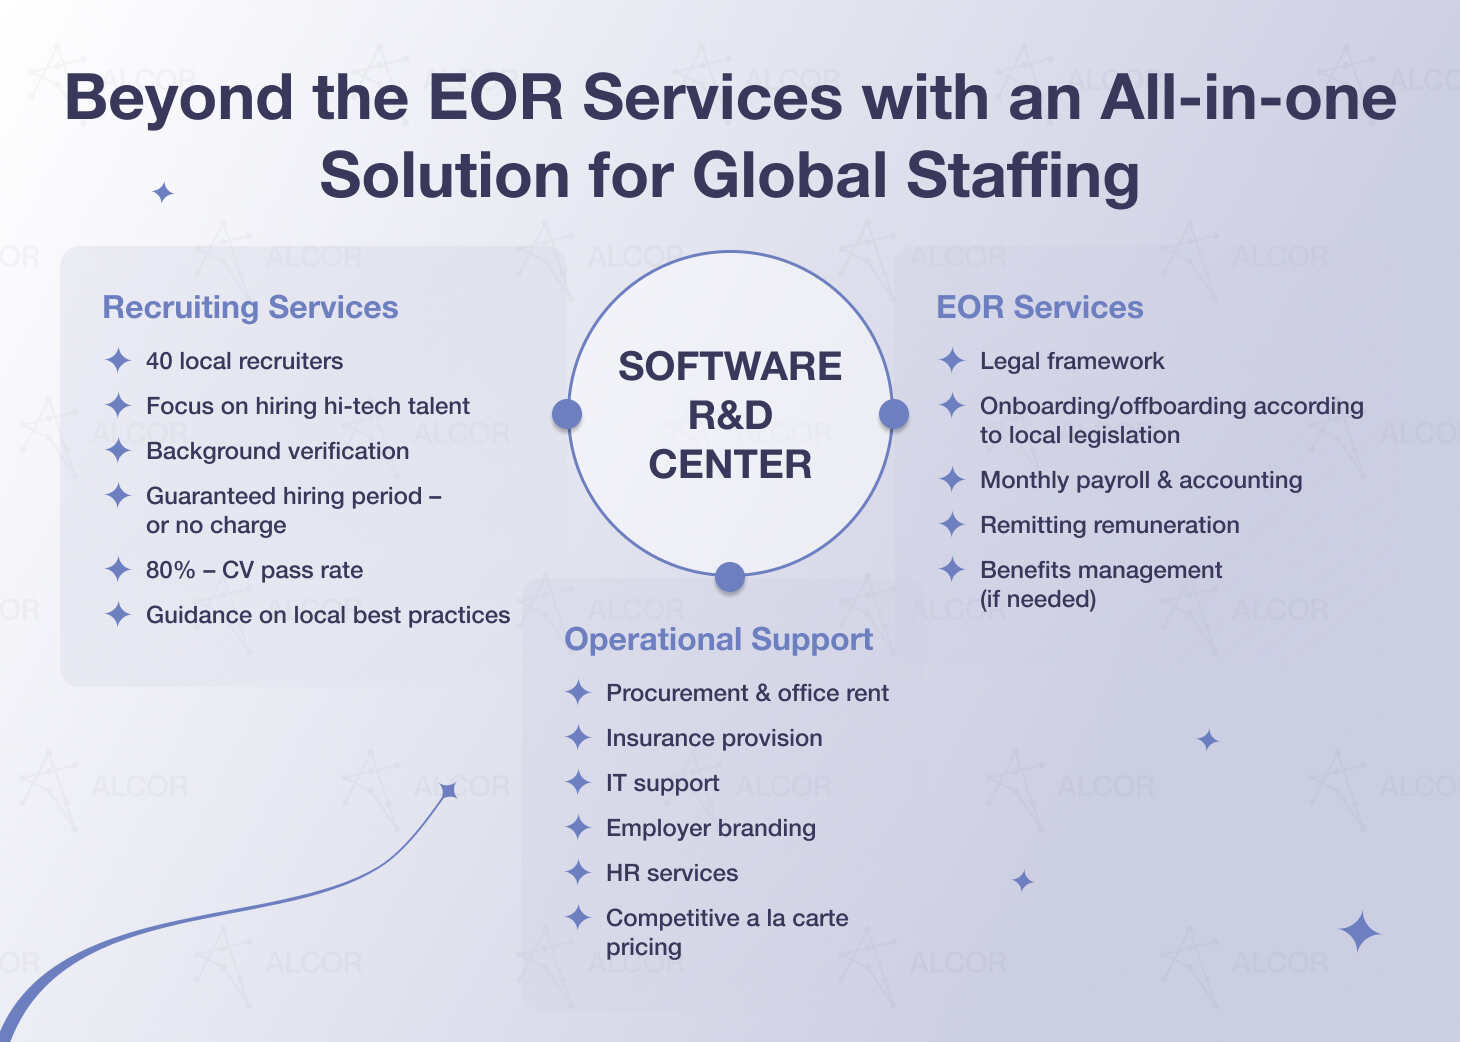
Alcor provides 360° operational support for tech companies building software R&D centers in LATAM and Eastern Europe. Alcor’s software R&D center model combines in-house tech recruitment, tech-exclusive EOR/COR, and operational support, covering senior hiring, compliant employment, payroll, tax management, IP protection, onboarding, equipment, travel guidance, equity consulting, and daily coordination. With Alcor, companies can expand abroad faster, avoid setting up local entities, reduce legal exposure, and choose tax-efficient markets with expert legal guidance.
Whether you’re a startup making your first engineering hires, a scaling tech company building out an AI/ML team, or a mature product company looking to expand without the overhead, Alcor has you covered. Alcor offers a software R&D center solution combining in-house tech recruitment, tech-exclusive EOR, and full operational support – one partner instead of three separate vendors, built to help you expand into low-tax countries across Eastern Europe and LATAM without the legal exposure of doing it alone. Our lawyers also advise you on taxes in the EU vs the US so that you can pick the location with the highest financial benefit for your business.
Here’s how it works in practice: ThredUP, a US-based consignment store, needed to set up a software R&D center in Eastern Europe without getting entangled in local labor laws when hiring Ukrainian developers. Alcor closed the gap end-to-end, delivering support across 3 dimensions:
- In-house tech recruitment: Alcor’s in-house recruiters drew from a pipeline of 325,000 vetted candidates to place a Senior Full Stack Engineer in just 2 weeks – building ThredUP’s team up to 30 senior engineers, including ML specialists, Java developers, and .NET Warehouse engineers.
- Tech-exclusive EOR/COR: Alcor built ThredUP’s entire Eastern European employment framework from scratch – compliant contracts, local accounting, tax management, and full IP coverage – with no local legal entity required, backed by a dedicated success manager and 10-day onboarding.
- Operational support: Beyond recruitment and EOR, Alcor handled business visa and travel consultations to keep the team connected across the Atlantic, plus equity consulting when ThredUP decided to offer stock options to its Ukrainian engineers – a benefit with no local playbook until Alcor built one.
The result: ThredUP’s 30-engineer Eastern European team helped power the company’s 2021 Nasdaq IPO, raising $175.5 million at a $1.3B valuation.
Backstory (ex-People.ai), Ledger, Dotmatics, and many others have already built their R&D teams this way.
Would you like to achieve the same success? Alcor is already in the starting blocks.
FAQ
How does the US tax system differ from the European one?
The US layers federal corporate tax, state income tax, FUTA, SUTA, and FICA with quarterly filings and year-end reconciliation – more filing complexity than most of Europe. Europe centralizes withholding through employers, but often carries a heavier social security burden, split across pension, healthcare, and other contributions rather than one combined tax.
Do Europeans, on average, pay more in taxes than Americans?
Yes, on average – but the gap narrows or reverses in Eastern Europe. The US tax wedge sat at 30.1% for a single worker in 2024, below the OECD average of 35.1% in 2025, per the OECD. That average is pulled up by high-tax Western European countries like Belgium (52.5%) and France. Eastern Europe tells a different story: Bulgaria and Romania both run flat corporate and personal tax rates at or near 10%, among the lowest in the EU.
What is the highest-taxed nation in the world?
There’s no single answer – it depends on which tax you’re measuring. Denmark holds the highest top marginal personal income tax rate at 60.5%, following its 2026 reform. Belgium has the highest overall tax wedge among OECD countries at 52.5%, per the OECD’s Taxing Wages 2026 report. Within our own comparison table, France stands out for social security specifically, with combined employer and employee contributions reaching 67–70% – the highest SSC burden of the countries we cover.
Are US taxes higher than in Europe?
It depends on the country: who pays more in taxes splits along a clear line: comparing taxes in Europe vs the USA, the US runs higher than Eastern Europe’s low-income tax countries – Poland, Bulgaria, Romania, Ukraine, and Hungary – but lower than most Western European states, including France, Germany, Denmark, and Italy.
What countries have no tax?
No country is entirely tax-free – every “no-tax” nation replaces personal income tax with something else. As of 2026, around 10 jurisdictions charge 0% personal income tax, including the UAE, Monaco, the Bahamas, the Cayman Islands, Bermuda, Bahrain, Kuwait, and Qatar, per PwC Worldwide Tax Summaries. Monaco’s 0% personal income tax comes with a 25% corporate tax rate; the UAE charges 5% VAT and a 9% corporate tax on business income.
How would you rate this article?
Alcor is Your Trusted Scaling Partner
for expansion
support